
How we aim to turn interactions with our technical support into a valuable experience
In recent years at WEGG, we’ve taken the time to reflect on how we deliver technical support. Together with the Marketing Team, we worked with a clear goal: aligning our service more closely with the Focus on Value principle, one of the pillars of ITIL 4.
For a long time, Technical Support was seen as a reactive service: a problem arises, a ticket is opened, we intervene, we close it. A structured flow, measured through metrics like response times and resolved tickets. Useful indicators, but incomplete ones—they only describe the most visible part of the service.
Behind every data point lies an experience. There are people, expectations, frustrations, relief. A simple example: a customer loses phone connectivity. The ticket is closed within the expected time, but in the meantime the customer had to repeat the issue multiple times to different operators and received no clear answers.
The result? A negative feeling—one that weighs more than any SLA met
So the first question we asked ourselves was: Are we really measuring the customer experience? Numbers help us understand operational efficiency, but they don’t describe how the customer feels or how supported they feel. This is why, alongside the technical metrics we were already collecting, we added qualitative measurements focused on experience.
We revisited the very concept of value. For us, it’s not the speed with which a ticket is closed; it’s about what the customer perceives throughout the entire journey—welcome, clarity, attention, and the reassurance of not being left alone.
This change in perspective led us to imagine support not as a switch to be flipped when needed, but as continuous guidance: we listen, contextualize, and build the best solution together
And improving the experience doesn’t just mean acting only on the resolution phase, but also on earlier steps. For example, feedback showed that opening tickets felt complicated, so we introduced a more immediate channel—sending requests via email to [email protected]—to simplify the process and reduce customer stress.
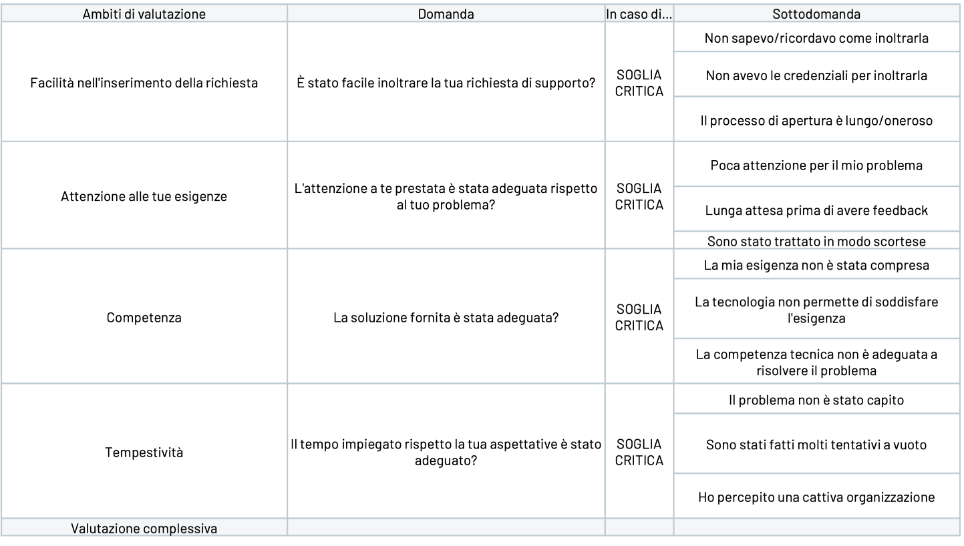
We divided the experience into three key moments—ticket opening, management, and closure—and for each one we identified the aspects that most influence service perception, allowing us to explore them in the feedback questionnaire.
1. Opening: the first impression
The entry point often sets the tone for everything that follows. If the process is simple, the customer already feels the situation is in good hands. This is why we measure ease and speed with a direct question: “Was it easy to submit your support request?”
2. Management: the heart of the relationship
It’s during management that the true quality of the service is perceived. It’s not only about technically correct answers—it’s about how well we read the customer’s situation. So we ask: “Was the attention given to you adequate for your problem?”
Once the context is clear, we recalibrate the priority together with the customer and decide what actions to take. This is where our new approach comes in: we don’t treat tickets as automatic operations—we immerse ourselves in the customer’s situation to provide truly informed and proportionate answers.
Una volta chiarito il contesto, ricalibriamo la priorità insieme al cliente e decidiamo quali azioni intraprendere. È proprio qui che entra in gioco il nostro nuovo approccio: non trattiamo i ticket come operazioni automatiche, ma cerchiamo di immergerci nella situazione del cliente per dare risposte davvero consapevoli e proporzionate.
In other words, management is not only about solving a problem: it’s about accompanying the customer while they face it.
3. Closure: the final assessment
Once the problem is resolved, the customer evaluates the experience mainly on two aspects:
An effective response delivered within the right timeframe can turn even a critical incident into a positive experience.
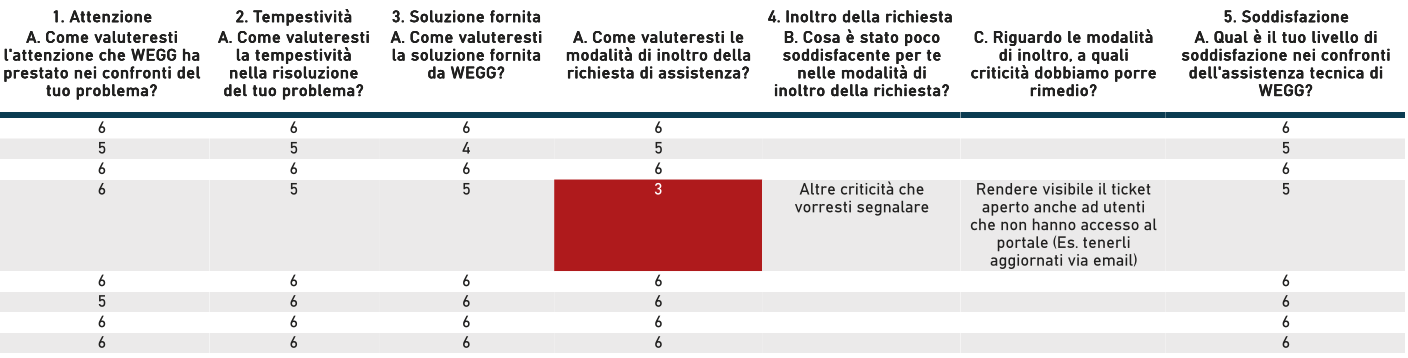
We also include one final question: “How would you rate your overall experience with our technical support service?”
To better capture nuances, we chose a 1–6 scale, which helps distinguish a fully positive experience from one that, while not negative, could be improved. Intermediate scores like 3 or 4 are often the most insightful, indicating that something didn’t meet expectations.
For this reason, when the rating falls below a certain threshold, the questionnaire automatically opens a short follow-up question with options to clarify what didn’t work. This way, feedback doesn’t remain an isolated number—it becomes a small story, a concrete context from which we can learn.
Thanks to this structure—stages, questions, scores, and follow-ups—we can better understand the customer experience from both a technical and relational perspective.
Not all aspects of the service have the same weight in customer perception. To understand this, we didn’t decide ourselves—we asked directly.
The preliminary survey revealed this order of importance:
We also collected preferences on how often customers want to receive questionnaires: some want them after every ticket, others monthly or quarterly, and some prefer not to receive them at all.
These preferences—modifiable at any time by contacting the Service Manager—are configured in our platform: each customer receives surveys only when and how they choose. If no preference is indicated, the default frequency is quarterly.
To make the feedback process more pleasant and less formal, we introduced a virtual butler: Alfredo.
Polite, light, and tastefully humorous, Alfredo guides customers through the questionnaires with a tone that’s anything but bureaucratic. This approach has increased not only the quantity, but also the quality of responses: human language generates more authentic feedback.
Alfredo also steps in proactively: if a customer hasn’t opened a ticket for a long time, he sends a message to check whether everything is working properly or to detect potential issues that haven’t been reported.
Collecting feedback only makes sense if the data leads to real actions.
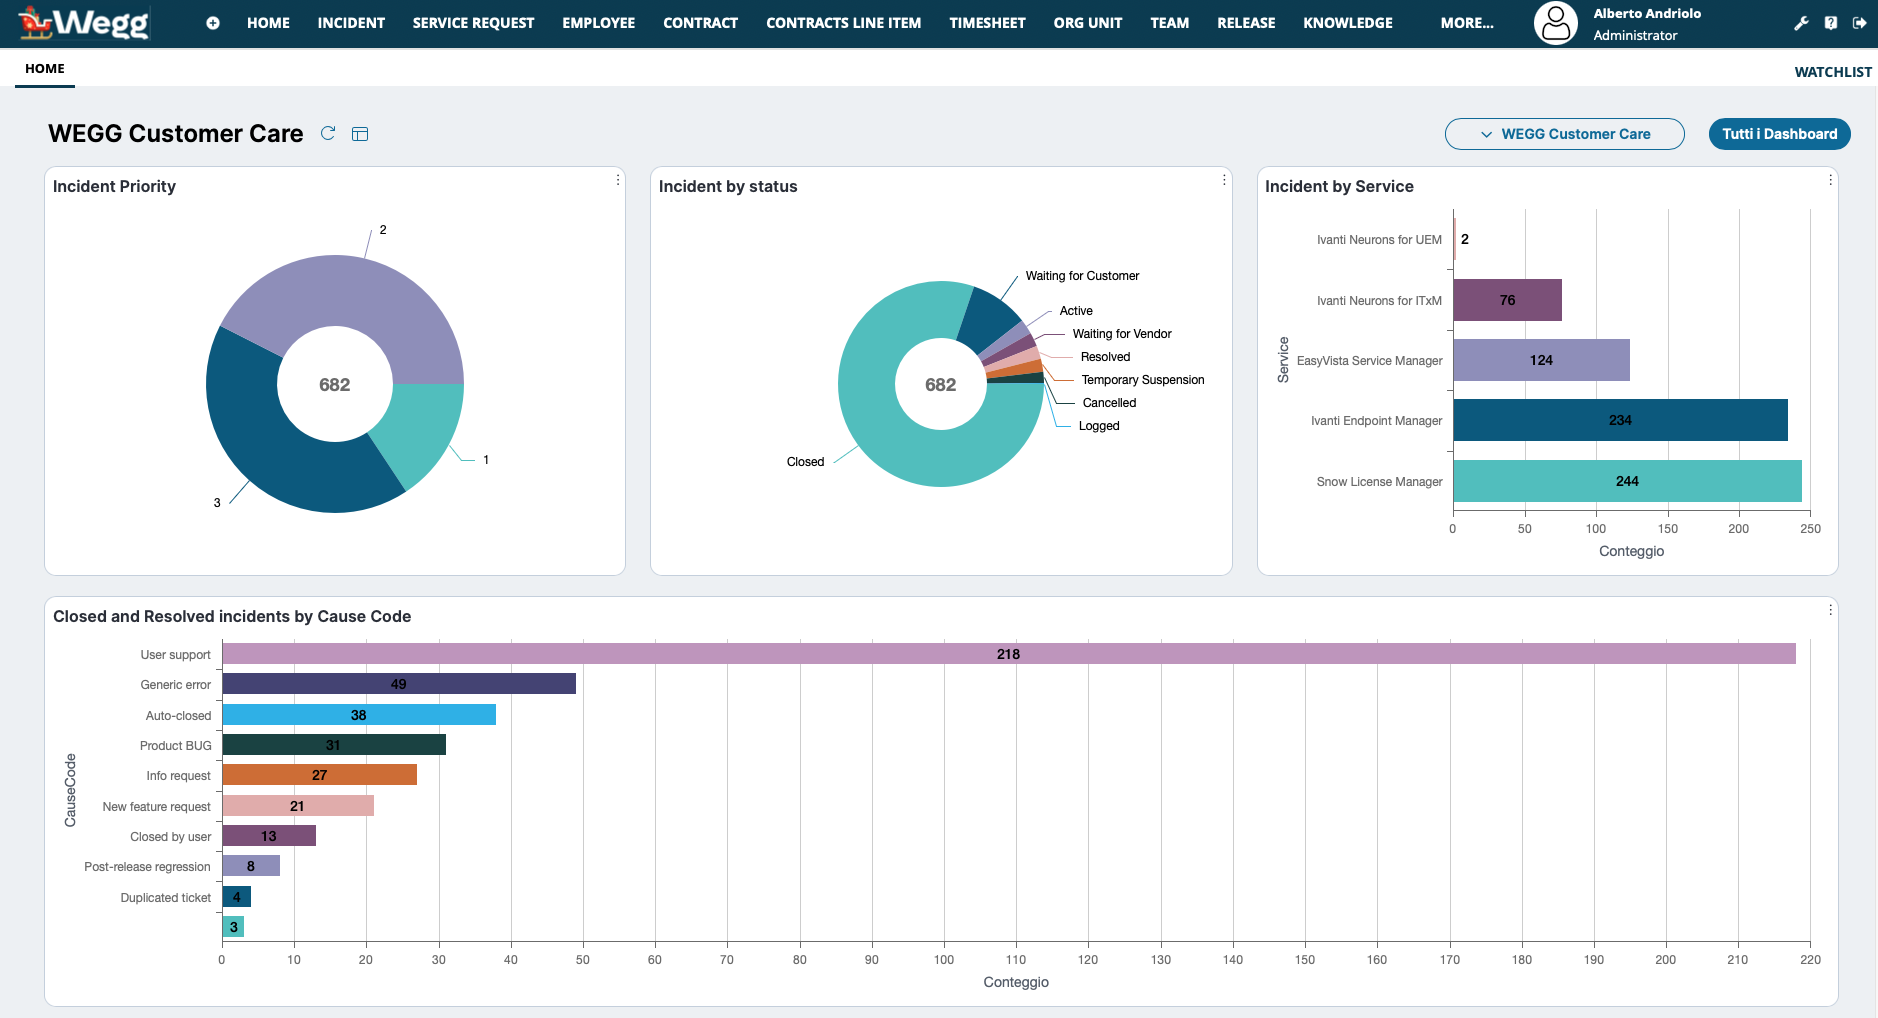
We configured an interactive Power BI dashboard that allows us to view aggregated results in real time. The questionnaires are anonymous, but the ability to analyze data by area helps us understand precisely, during periodic reviews with the whole team, where to intervene and which aspects to focus on with our operators.
Concrete examples:
Questo ciclo continuo di raccolta e interpretazione dei feedback ci consente di evolvere il servizio in tempo reale, adattandoci alle esigenze dei clienti e anticipando le criticità prima che diventino problemi strutturali.
In questo modo, il Customer Care non è più solo un meccanismo di risposta, ma un vero e proprio sistema di allerta precoce e un motore di miglioramento continuo per l’assistenza tecnica, capace di superare la logica reattiva per abbracciare un approccio proattivo e orientato alla relazione.
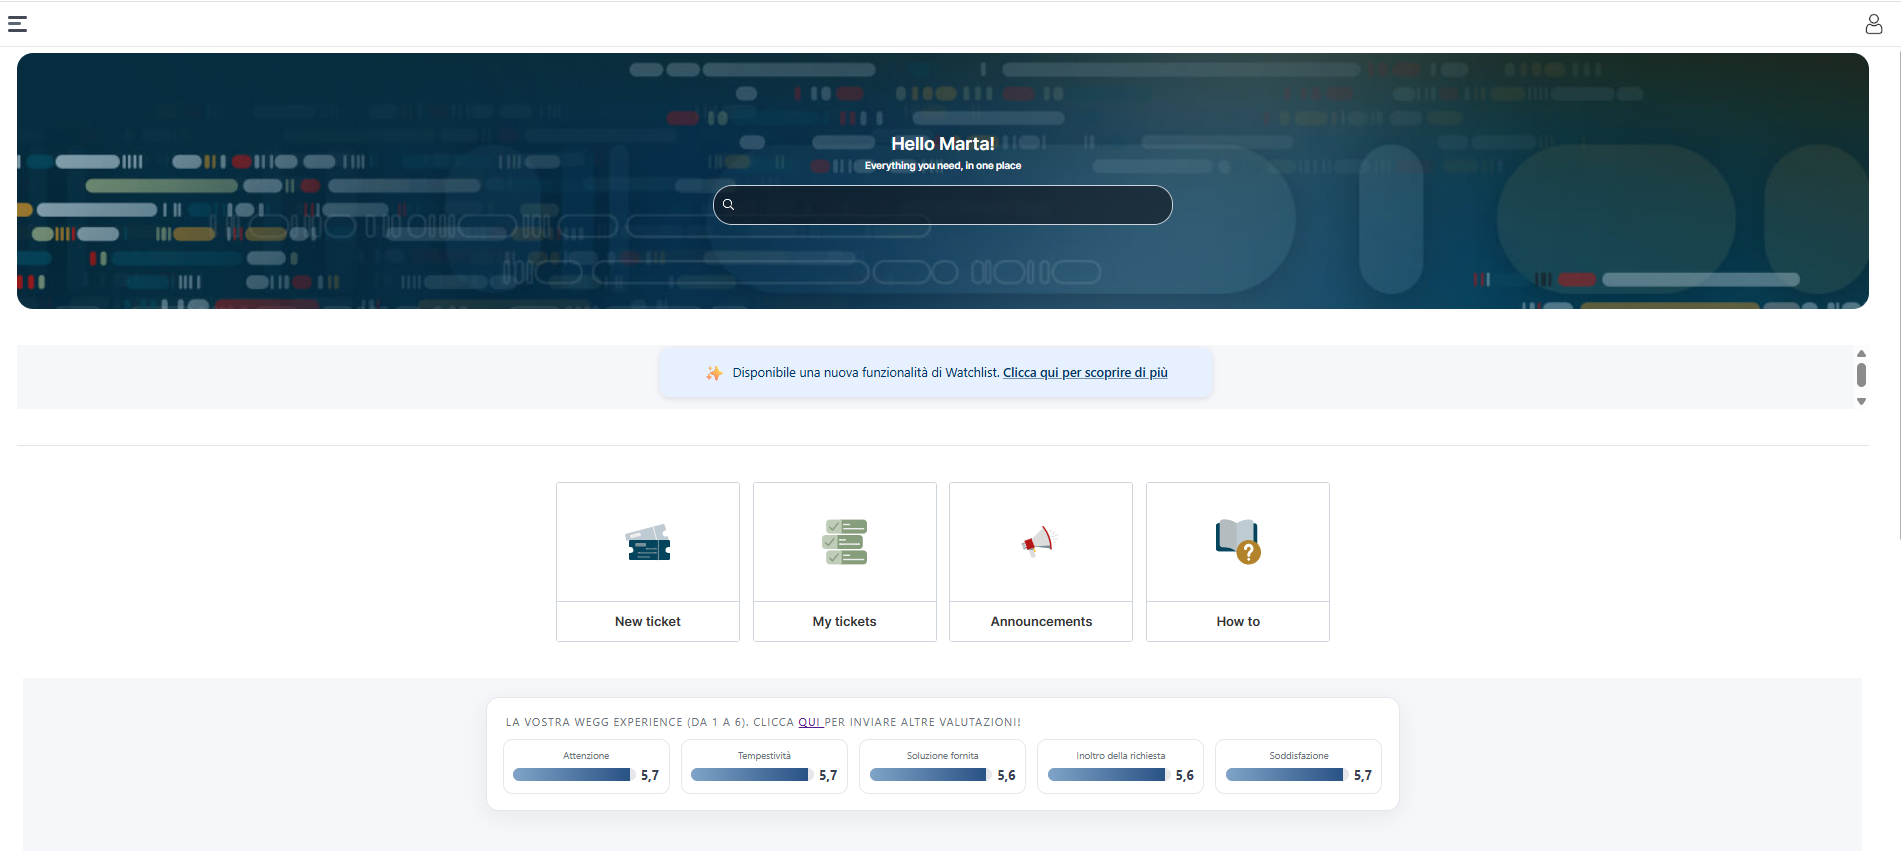
Finally, we decided to make the aggregated experience indicators visible directly on the Home page of our Technical Support Portal. This ensures maximum transparency and, at the same time, keeps our team focused so that evaluations remain consistently positive.
Conclusion: from ticket to relationship
Our goal is not only to solve technical problems: we want to build a relationship with each customer based on trust, transparency, and attentive listening. Every piece of feedback is an opportunity to improve, anticipate needs, and make our support increasingly human and helpful.
This is why we ask all our customers to lend us a hand: their feedback is essential in enabling us to support them better. We are aware that we are not perfect, and precisely for this reason we commit ourselves every day to improving.
By Alberto Andriolo, Service Manager
Insights

OUR OFFICES
OUR OFFICES
PADUA
Via Arnaldo Fusinato 42, 35137
MILAN
Viale Enrico Forlanini 23, 20134
ROME
Viale Giorgio Ribotta 11, 00144
Copyright © 2025 WEGG S.r.l. • P.I 03447430285 • C.F. 02371140233 • REA 311023
Azienda Certificata ISO 9001:2015 – ITA / ISO 9001:2015 – EN


